
By
Thomas D. DeWitt and Douglas A. Lyon
We define the pitch of a grating to be the spacing between the centers of adjacent grating slits. The phenomena disclosed here are most pronounced when using grating whose pitch is less than, or near to, the wavelength of the illumination incident upon the grating. This appears up to a limit at gratings of a pitch half that of the illumination's wavelength. We demonstrate a magnification effect can be achieved with such gratings in the near-field.
Section 1 reviews the technology of near-field range finding. It includes a brief survey of near field range finding methods and a literature survey.
Section 2.1 presents a mathematical model of a diffraction rangefinder with alternatively a perspective center and a simple lens for image formation. The assumption in this section is that the sensor and target form a line orthogonal to the grating plane. Section 2.2 extends our analysis to a more general case where source illumination is not restricted to a line which is strictly orthogonal to the grating plane. Section 3 compares experimental results with predictions based on the models given in Section 2. In Section 4 we offer a model for the use of the Scheimpflug condition. Section 5 is a comparison with other rangefinding methods in the light of the unique features of diffraction range finding.
Triangulation methods are the most common form of range finding in use, but their inherent limitations have stunted exploitation. All triangulation methods have zones of occlusion, particularly in the near-field. The near-field blind areas are in the very region where accuracy would be greatest, given that for triangulation and stereoscopy, accuracy is inversely proportional to target distance. Occlusion liability can be lowered by decreasing the baseline between transmitter and receiver, thereby lowering the triangulation angle, but this results in a sacrifice of resolution. Another restriction affecting triangulation methods is that in scanning modes intended to acquire range data over an area of view, it is inconvenient to synchronize the movement of structured illumination with the view field of the receiver. Solutions to this problem have been proposed but have not enjoyed widespread use.[2] As a result, when staring arrays are used to receive, resolution is sacrificed to achieve a significant field-of-view over a work area.
Range finding by focus analysis has the advantage over triangulation of being monocular, that is, the source of illumination and the receiver can be coaxial. This advantage would seemingly overcome the synchronization problem for area scanning. However, the lenses used for accurate range measurements by focus analysis have relatively large primary elements, because they work by minimizing depth-of-field. Such large instruments can be awkward to scan quickly. Adjusting focus on large lenses also carries a mechanical penalty; it is time consuming. In the extreme near-field, where microscopes can be used, the small target distances reduce the need for large primary elements. However, microscopes present their own practical limitations. These include a narrow band of range detection, a limited field-of-view, and an extremely short work stand-off between instrument and target. Focus analysis computations can be simple for point by point measurements, since these only require minimizing the circle-of-confusion by a mechanical adjustment of the objective. However, as the overall depths to be ranged are broadened, the mechanical travel of such adjustments become time consuming. If a mechanically passive method is used, as might be required when the source of illumination is a projected line for profilometry, focus analysis becomes computationally expensive and less reliable due to variations in target reflectivity.
Interferometric methods of ranging can be monocular (coaxial transmitter and receiver), but they operate only in a relative coordinate space of contiguous target surfaces. Any abrupt discontinuity in a target surface produces ambiguous results. In the otherwise exquisitely sensitive wavelength interference designs, as was first shown by the Michaelson-Morely experiment and now are routinely used for measuring the surfaces of lenses, discontinuities in target surface topology cannot easily be resolved.
Moiré methods are a form of interferometry which allow for a much coarser increment of depth measurement than classical interferometry based on the wavelength of light. Nonetheless, moiré methods suffer ambiguity for target discontinuities greater than these coarser steps of measurement. Moreover, moiré methods have all the occlusion problems associated with triangulation, and the remedy of lowering the angle between transmitter and receiver carries the penalty of resolution loss just as it does in triangulation. The primary advantage of moiré is temporal. An entire surface can be acquired in a single camera exposure, albeit the post acquisition processing can be quite time consuming.
Time-of-flight methods of range finding in their native forms do not suffer from the ambiguities of a relative coordinate system. Ultrasonic ranging has evolved into an economical method for many applications, but sonar is primarily limited to liquid and solid media for imaging. In air, the angle of dispersion of the sound beacon is too broad to conveniently form an image. Ultrasonic electronics also tend to fail at short ranges, because the illumination chirp interferes with echo detection. Similar near-field blindness affects most forms of radar and lidar. Moreover, with these higher frequency media, time-of-flight measurements tax the fastest electronic detectors for small increments of range measurement. There are types of lidar which overcome some of these limitations in accuracy and near-field blindness. A detailed analysis of the modulation methods used is beyond the scope of this article. However, as a general rule, these methods do not work well in the extreme near-field, under ten centimeters, and they carry an ambiguity penalty similar to interferometry methods.
For a point source radiator at infinity, the intensity maxima are perceived at angles off the normal according to the equation:
(1)

where r is angle of the received maxima, l is the wavelength of the incident radiation, p is the diffraction pitch, n is the diffraction order, an integer.
When the incident wave front striking the grating originates off the surface normal, a second term must be considered. We will call it angle i, the angle of the incident wave front and
(2)

Equations (1) and (2) are referred to as the Grating Equations and are well known relationships.[3]
Consider the model shown in Figure 1. A point source radiator at O is viewed through grating G. The range is D, while d is the standoff between the grating and a perspective center C.
Using the relationship in Equation (2) as a basis, we have previously shown in a prior publication[4] that:
(3)

Equation (3) is useful, because it defines range as a function of r, the angle at which the higher-order images are received behind the grating. However, image formation requires a lens, so the equation must be further refined. Consider the model in Figure 2. A camera lens of focal length F forms an image at the focal plane. The high-order diffraction image forms at an offset, x, from the zero-order at the center.
Similar triangles can be identified on either side of the lens, so that:
(4)

and
(5)

must be true.
Substitution in of (4) and (5) into (3) yields:
(6)

To our knowledge, even though Equations (3) and (6) fall out directly from the Grating Equation (2), they did not appear in the literature prior to our publications.[5] Our claim that a target's range could be correlated to the angle subtended by its diffracted image was sufficiently novel to be awarded a basic method patent.[6]
 can be found by similar triangle ratios. DL can then be derived.
 We can write
(7)

where
(8)

A detailed derivation for (7) and (8) appears in Appendix A.
An off-axis model for diffraction range finding other than the one offered here was the topic of a 1987 NSF SBIR grant.[7] This model did not include a perspective center for the observer, and as a result its mathematical derivations arrive at a different set of expressions than ours. However, this work does broach the issue of maxima intensity. With the exception of calculating the Bragg angle (where one can anticipate high grating efficiency) we have left this topic for our future research. This is because, in part, we have a special interest in high frequency gratings where intensity models are particularly idiosyncratic and not categorized by closed form relationships.
As we did for the geometric relationship (3) we can modify (7) to include the a simplified camera model. A further parameter, [[rho]], is included to describe the rotation of the camera toward the diffraction image.
(9)

where
(10)

Where it is more convenient to measure X, the distance from the grating to the camera along its axis of view, rather than d, the normal from the grating plane to the lens, we can substitute
(11)

We have coined an expression, the occlusion liability angle, for [[beta]], the difference between the illumination angle, [[alpha]], and the angle incident upon the grating, i.
(12)

This parameter can be used as the basis of comparison of the diffraction method with triangulation where occlusion liability is a key performance criterion.
Consider a coarse grating with a pitch of 5555 nm. We conducted an experiment using the bench set-up illustrated in Figure 4. A test block was used as a target. It had milled steps of 0.1 inch (2.54 mm). The target was illuminated with a 670 nm laser stripe that was projected through an open gap in the grating. (Projection through the grating itself would have produced a multiplicity of illumination stripes. This is a strategy sometimes used in triangulation devices, and a comparison with our method appears in Section 5)
Using equations (7) and (8) we can graph the received angle of diffraction vs. the range as shown in Figure 5. The occlusion liability angles, [[beta]], are shown in the matching graph. The predicted camera image is graphed in Figure 6. We assumed a camera at a distance d of 20 cm to the grating, a lens with focal length F=25mm, and a target range of 30 to 70 mm. Our experimental result is shown in the matching camera recording in Figure 6. The image is of a test block with 0.254 mm steps. It must be noted that the grating used to produce the image was an inexpensive embossed plastic sheet (available from Spectratek of Los Angeles).
The effect of a 20[[ring]] off-axis rotation of the source illumination with the 5555 nm grating is illustrated in Figure 7. The negative orders are no longer symmetrical with the positive orders. It can be argued that this effect increases the sensitivity of a grating to range[8], but since the zero-order also shifts according the principle of triangulation, the increased sensitivity is really a compound effect of both triangulation and diffraction. A camera recorded image of our test block positioned 30 mm from the grating is shown in Figure 8.
Another means to increase grating sensitivity to range is to decrease the grating pitch relative to the wavelength of the source illumination. We illustrate the phenomenon using a grating whose pitch is ten times finer than that used in two experiments above.
Consider the bench experiment shown in Figure 9. A step test block is illuminated by a laser with a relief s of 100 mm and a rotation of [[alpha]] =-22[[ring]]. The negative rotation optimizes the sensitivity to range at the expense of occlusion liability as graphed in Figure 10. The sensitivity is sufficient to magnify range resolution relative to a corresponding lateral dimension. Referring to Figure 11, we can compare predicted and actual performance for an image taken with a 25 mm lens where the median distance, d, from the grating plane to the camera is 245 mm. Each vertical line in the camera image corresponds to a length of 2.54 mm. The horizontal steps represent a 2.31 increment of range along DL. The experiment demonstrates that range sensitivity is equal to or greater than sensitivity to the corresponding lateral dimension.
Occlusion liability can be lowered while maintaining range sensitivity if diffraction range finder parameters are adjusted properly. For gratings with a pitch shorter than illumination wavelength, consider the change in the incident angle i vs. the receiving angle r. The function produces a generic relationship graphed in Figure 12. The point at unity slope where i equals r is the Bragg Angle [[psi]]. For values of r above the Bragg angle, a change in r is greater than an equal change in i. When proper adjustments are made for input angle and view angle, the grating can serve as a magnifier.[9] Moreover, if the range finder is designed to use angles centered on the Bragg angle, relatively efficient transmission of light is assured.
A method of compensation for increasing depth of field is suggested in the following section.
If a long focal length lens is used in a diffraction range finder, which could be the case if grating size was to be held to a minimum, the diffraction method lends itself to a special form of focus compensation. When a lens is used to form an image of a sloping object, the object plane, the image plane and median plane along the lens will all meet together at a common point. We illustrate this in Figure 13. This method of focus compensation is called the Scheimpflug condition.[10]
The object plane lies on the line segment AC. The image plane lies on the line segment AD. The median plane passes through the lens and lies on the line segment AB. All planes are shown to meet at a common point, A, which forms the apex of two right-angle triangles, ABC and ABD. These triangles share a common side (AB) whose length is denoted l. Optical axis of the camera lies on line segment CD.
If we let angles CAB be denoted a, ACB be denote e, BDA be denoted g and assume that we have a simple converging lens of focal length f, then:
(13)

must be true. The proof of (13) appears in Appendix B.
The geometric model of the Scheimpflug condition becomes more interesting when a diffraction grating is inserted between the lens and the object to be imaged (i.e., in front of the camera). A sketch of this model is shown in Figure 14.
The position sensor and target are at arbitrary angles with respect to the diffraction grating. The relation between the angle of the position sensor, g, with respect to the main optical axis, ZD, the position sensor distance from the lens, object pose (position and orientation), lens focal-length, diffraction-grating pitch, diffraction-image order and illumination wavelength shown in Figure 14 is:
(14)

The proof of equation (14) is given in Appendix B.
Near-field blindness which is endemic to all stereoscopic and triangulation devices can be avoided in diffraction range finders, since they can be designed to work to point-of-contact. Moreover, in diffraction range finders the source of illumination and the receiver can be co-axial. Such a configuration overcomes synchronization problems that affect scanning triangulation sensors. The occlusion problems characteristic of triangulation can be moderated by using multiple cameras and relatively narrow base lines between projector and sensor. Our diffraction method can achieve similar benefits with a single camera viewing multiple higher-order images. If the source of illumination is directed off-axis, the diffraction method can be combined with triangulation to produce a compound effect that has the features of both methods. Another marriage of technologies could include anamorphic lenses and the diffraction magnification feature we have disclosed here.
Lenses in themselves have the ability to measure range through focus analysis. Like the diffraction method, these methods are monocular, that is, transmitter and receiver can be coaxial. However, compared to diffraction method, which measures the deflection of a point, the focus analysis method is computationally expensive. It requires that a measurement be made on a Gaussian spot which can vary widely in brightness depending on target reflectivity. The computation can be avoided by mechanically focusing the spot to smallest diameter, but this method is cumbersome for large lenses. Unfortunately, the accuracy of the focus analysis method is proportional to the size of the lens. The diffraction method is also scaled by the size of the grating, that is, the more distant the point the larger the grating required to range it, but we have demonstrated that plastic embossed holographic gratings can be used. Compared to lenses, even Fresnel lenses, these plastic gratings are very cost effective. Furthermore, no mechanical focusing is required if the diffraction range finder has Scheimpflug compensation.
Interferometric methods of range finding share some of the same underlying physics with our diffraction method, since both rely on the behavior of wave fronts that form constructive peaks and destructive nodes. However, the grating method returns range measurements in absolute co-ordinates, whereas classical interferometry produces relative measurements that can be ambiguous over discontiguous surfaces. Moreover, while we have used laser light for convenience, the diffraction method does not require coherent illumination. It works perfectly well in incoherent multi-spectral illumination provided that a point source can be resolved on the target surface.
Time-of-flight methods of range finding have distinct advantages over diffraction in the far field, but for near-field work, the diffraction method is superior. The diffraction method improves in accuracy inversely with target distance, and there is no cross talk between the transmitter and the receiver as there is with time-of-flight methods.
This research was performed, in part, on grants from the National Science Foundation and the New York State Science and Technology Foundation.
(A.1)

Referring to Figure 3 in the body of the text, the length along a normal from the median extending to the point of the observed higher-order diffraction can be determined by
(A.2)

The side [[Delta]]s to the right triangle formed by DL and
 can be found by
(A.3)

We use side ratios of similar triangles to express the normal distance from the
grating,
 ,
along the line of illumination projected from a laser.
(A.4)

Substituting (A.2) and (A.3) into (A.4) we have
(A.5)

The distance from the grating along the laser line, DL, is
(A.6)

Solving for

(A.7)

Substituting in (A.5):
(A.8)

Solving for D
(A.9)

Equating (A.1) and (A.9)
(A.10)

Dividing both sides of the equation by
 and simplifying results in:
(A.11)

Partially solving for DL yields
(A.12)

For the sake of notational convenience we will use the convention that:
(A.13)

Substituting in (A.12):
(A.14)

Solving (A.14) for DL yields:
(A.15)
 .
.
We substitute
 in (A.15) to show that this results in (A.1):
(A.16)

Substituting (A.13) into (A.16) results in (A.1):
(A.17)

The distance from the camera to the grating along X is given by:
(A.18)
 .
.
Substitute (A.18) into (A.15) yields:
(A.19)
 .
.
We define the angle,
 ,
as the occlusion liability angle so that
(A.20)
 .
.
Solving the Grating Equation, (2), for i yields
(A.21)
 .
.
Substituting (A.21) into (A.20) and solving for
 ,
yields
(A.22)
 .
.
Given a camera with focal length F, rotated from the normal by angle
 ,
and with focal plane image displacement x, we can use trigonometry to
find:
(A.23)
 .
.
Substituting (A.23) into (A.13) yields
(A.24)

Substituting (A.23) into (A.15) yields
(A.25)

Substituting (A.24) into (A.25) yields
(A.26)

Simplifying yields:
(A.27)


where f is the focal length of the lens, e is the angle the target makes with respect to the optical axis, q is the distance from the lens to the target and g is the angle the sensor makes with respect to the optical axis. In the subsequent subsection we combine this result with diffraction.
A geometric model of the Scheimpflug geometry is shown in Figure 13.
Proof:
For right-angle triangle ABC:
(B.1)

(B.2)

and
(B.2a)

For right-angle triangle ABD:
(B.3)

(B.4)

and
(B.4a)

For a simple converging thin lens of focal length f:, we invoke the Gaussian lens formula:
(B.5)

Substituting (B.2) and (B.4) into (B.5), and solving for g:
(B.6)

Equating (B.1) with (B.3) results in
(B.6a)

Substituting (B.4a) and (B.2a) into (B.6a) yields
(B.7)

simplifying (B.7) yields
(B.7a)

We substitute (B.7a) into (B.6) to obtain:
(B.8)

Equation (B.8) shows the film-plane angle for the Scheimpflug condition as a function of the object pose and lens focal-length.
Q.E.D.
B.2. Diffraction and the Scheimpflug Condition
In this section of the paper we introduce a diffraction grating into the camera. Using the diffraction image from the position sensor, we are able to compute the range of the object.
The purpose of this section is to compute what angle to place the position sensor inside of the camera given the position sensor distance from the lens, object pose (position and orientation), lens focal-length, diffraction-grating pitch, diffraction-image order and illumination wavelength. The construction is shown in Figure 14.
The diffraction grating lies on the line segment JC. A point-source of light at location X is seen by the position sensor as having a high-order diffraction image which appears to be located at point Y. In fact the point source of light at location X emits a ray which lies on line segment XJ and is bent by the diffraction grating to lie on line segment JB, passing through the lens. The length of the object, t, is known. Also known, is its angle, k, with respect to the optical axis. In the following proof, we shall make use of these parameters, and the fact that right-angle triangle XYZ has a side in common with right-angle triangle BYZ.
Triangle XJB is subject to the diffraction equation:
(B.9)

where n is the diffration order,
 is the wave length and p is the grating pitch.
The following equation is identical to equation (3) of section 3 with the exception that there are some notational substitutions. These differences are needed to account for the new Scheimpflug construction shown in Figure 14:
(B.10)

Solving (B.10) for q results in:
(B.11)

In addition, because the Scheimpflug condition still applies, equation (B.8) must still be true, that is:
(B.8)

substituting (B.11) into (B.8) yields:
(B.12)
 .
.
Since triangle XYZ is a right-angle triangle and since we know the angle of the object, k, and its length, t, we can show that:
(B.13)

and that
(B.14)

By basic trigonometry we can see that
(B.15)

must also be true. Equating (B.13) and (B.14) we may solve for e:
(B.16)

It can be seen from the figure that
(B.17)

Substituting (B.14) and (B.17) into (B.16) yields
(B.18)

Finally, we observe that right-angle triangle BYZ has a side in common with right-angle triangle XYZ so that
(B.19)

Substituting (B.13), (B.14) and (B.17) into (B.19) results in
(B.20)

Substituting (B.18) and (B.20) into (B.12) results in an equation which yields the angle of the position sensor as a function of the distance of the object from the grating, d, the distance of the grating from the lens, q, the diffraction grating pitch, illumination wavelength, diffraction order, focal length, object length and object angle:
(B.21)

Q.E.D.

Figure 1. A Simple Geometric Model of Diffraction.
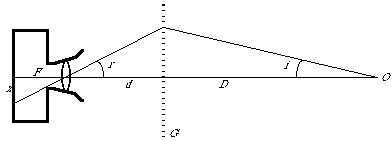
Figure 2. Geometric Model of a Camera with Lens and Grating
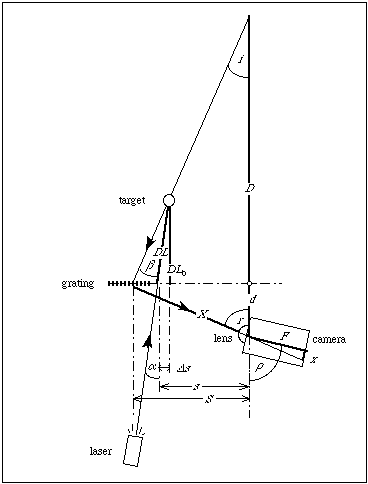
Figure 3. General Case of a Diffraction Range Finder
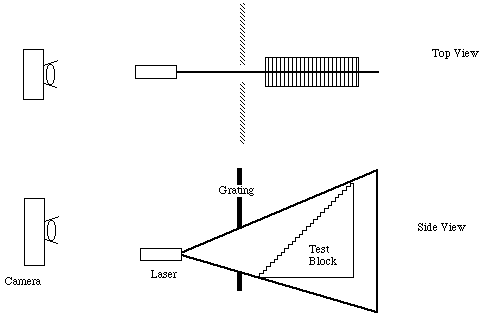
Figure 4. Bench Test for low frequency grating (p = 5.55 um. [[lambda]] = 670 nm). Camera to grating distance d = 20 cm. Test block steps 2.54 x 2.54 mm
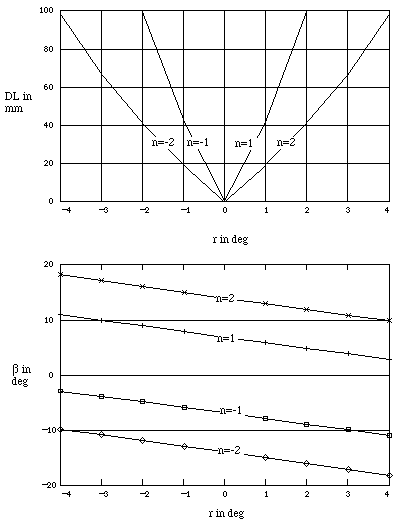
Figure 5 Graph of range DL vs. angle of received diffraction image r for +1st and 2nd order
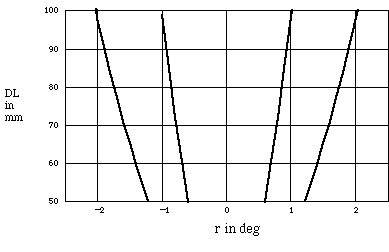
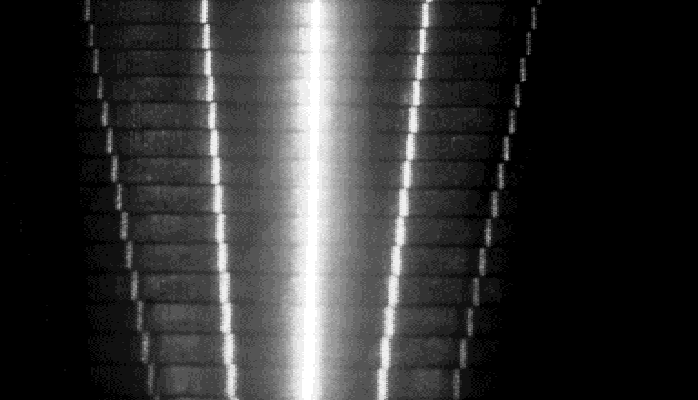
Figure 6 Camera Image of test block with low frequency grating.
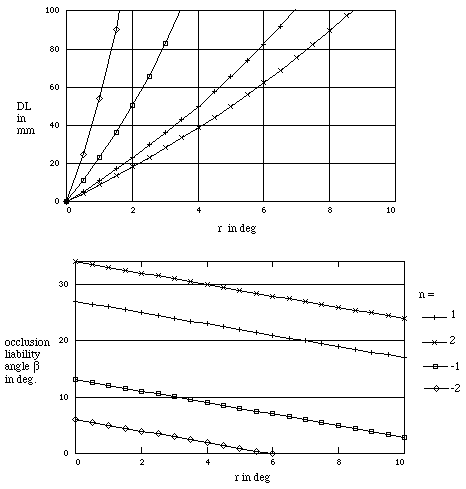
Figure 7. Predicted behavior of off-axis illumination and a comparison of occlusion liability angles for + 1st and 2nd orders.
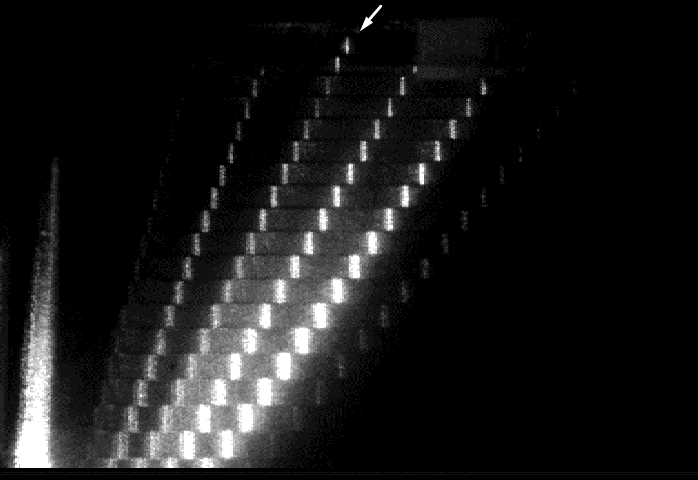
Figure 8 Off Axis Illumination with a 5555 nm grating. [[alpha]] = 20[[ring]] The zero-order is identified with an arrow.
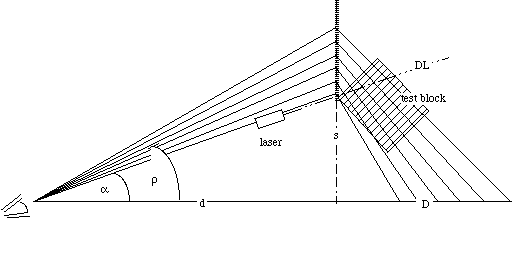
Figure 9 Set-up Diagram for experiment with high frequency grating. Sight lines are ray-traced. The target is a step block rotated by 25[[ring]] to optimize illumination levels.
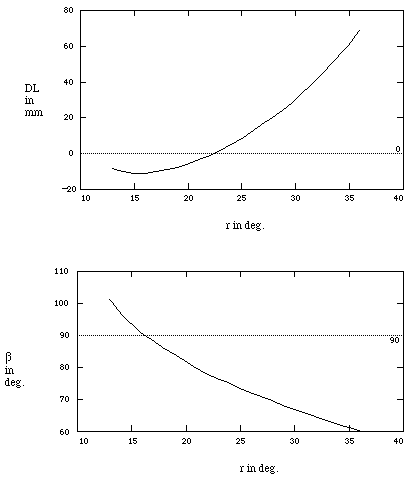
Figure 10. Receiving angle vs. range DL with a 555 nm where [[alpha]] = 22[[ring]] and s = 100 mm and the occlusion liability angles for corresponding receiving angles.
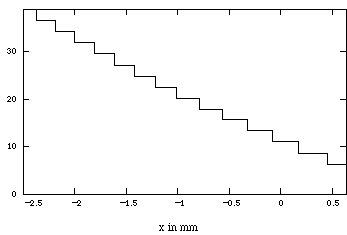
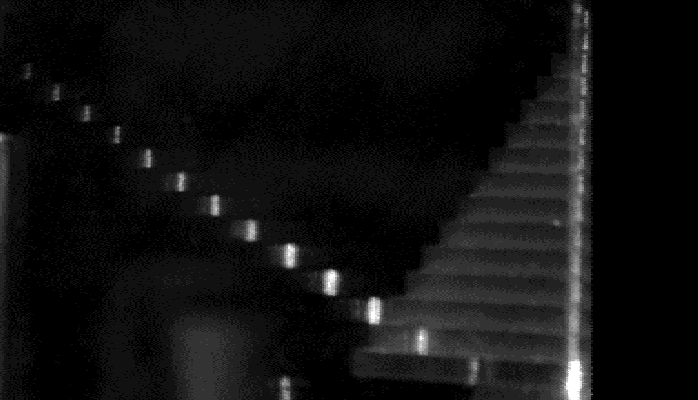
Figure 11. Comparison of predicted performance with camera recorded image using high frequency grating. The camera has a sensor measuring 6.41 mm in the horizontal given as x in the graph. The zero-order image appears in the camera image as the vertical line.
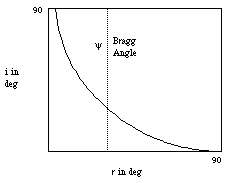
Figure 12. Generic curve relating incident and receiving angles for gratings with pitch shorter than incident illumination. At angle [[psi]], i = r.
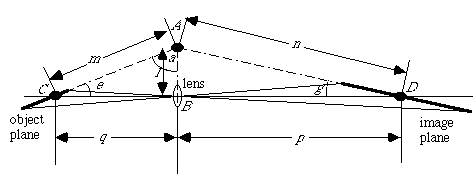
Figure 13. Geometric Model of the Scheimpflug Condition
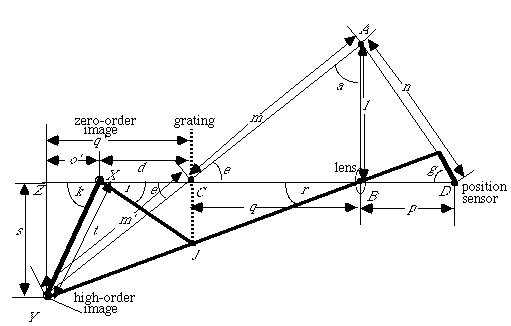
Figure 14. Geometric Model of Diffraction and the Scheimpflug Condition
Figure Captions
Figure 1. A Simple Geometric Model of Diffraction.
Figure 2. Geometric Model of a Camera with Lens and Grating
Figure 3. General Case of a Diffraction Range Finder
Figure 4. Bench Test for low frequency grating (p = 5.55 mm. l = 670 nm). Camera to grating distance d = 20 cm. Test block steps 2.54 x 2.54 mm
Figure 5 Graph of range DL vs. angle of received diffraction image r for +1st and 2nd order
Figure 6 Camera Image of test block with low frequency grating.
Figure 7. Predicted behavior of off-axis illumination and a comparison of occlusion liability angles for + 1st and 2nd orders.
Figure 8 Off Axis Illumination with a 5555 nm grating. a = 20[[ring]] The zero-order is identified with an arrow.
Figure 9 Set-up Diagram for experiment with high frequency grating. Sight lines are ray-traced. The target is a step block rotated by 25[[ring]] to optimize illumination levels.
Figure 10. Receiving angle vs. range DL with a 555 nm where a = 22[[ring]] and s = 100 mm and the occlusion liability angles for corresponding receiving angles.
Figure 11. Comparison of predicted performance with camera recorded image using high frequency grating. The camera has a sensor measuring 6.41 mm in the horizontal given as x in the graph. The zero-order image appears in the camera image as the vertical line.
Figure 12. Generic curve relating incident and receiving angles for gratings with pitch shorter than incident illumination. At angle y, i = r.
Figure 13. Geometric Model of the Scheimpflug Condition
Figure 14. Geometric Model of Diffraction and the Scheimpflug Condition
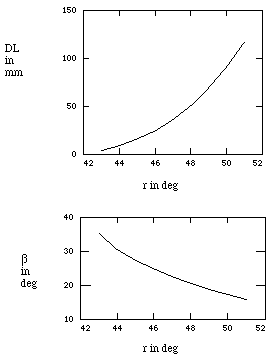
Figure 14. Receiving angle correlated to range DL and occlusion liability angle [[beta]].
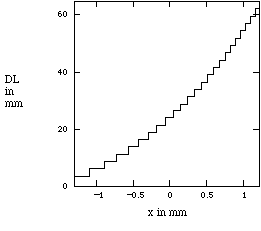
Figure 15. Camera model prediction for a test block of 2.54 mm steps assuming a 25 mm lens on a camera 18 cm from the grating.