5. Digital Image Processing
Fundamentals
There’s more to it
than meets the eye.
–19th century proverb
Digital image processing is electronic data processing on
a 2-D array of numbers. The array is a numeric representation of an
image. A
real image
is formed on a sensor when an energy emission strikes the sensor with
sufficient intensity to create a sensor output. The energy emission
can have numerous possible sources (e.g., acoustic, optic, etc.).
When the energy emission is in the form of electromagnetic radiation
within the band limits of the human eye, it is called visible light
[Banerjee]. Some objects will reflect only
electromagnetic radiation. Others produce their own, using a
phenomenon called radiancy.
Radiancy occurs in an object that has been
heated sufficiently to cause it to glow visibly
[Resnick]. Visible light images are a special
case, yet they appear with great frequency in the image processing
literature.
Another source of images
includes the synthetic images of computer graphics. These images can provide
controls on the illumination and material properties that are
generally unavailable in the real image domain.
This chapter reviews some of
the basic ideas in digital signal processing. The review includes a
summary of some mathematical results that will be of use in Chapter
15. The math review is included here in order to strengthen the
discourse on sampling.
5.1. The Human Visual System
A typical human visual system
consists of stereo electromagnetic transducers (two eyes) connected
to a large number of neurons (the brain). The
neurons process the input, using poorly
understood emergent properties (the mind). Our
discussion will follow the eye, brain and mind ordering, taking views
with a selective focus.
The ability of the human eye
to perceive the spectral content of light is called color vision. A
typical human eye has a spectral response that varies as a function
of age and the individual. Using clinical research, the
CIE (Commission Internationale de
L’Eclairage) created a statistical
profile of human vision called the standard observer. The response curves of the standard observer indicate
that humans can see light whose wavelengths have the color names red,
green and blue. When discussing wavelengths for visible light, we
typically give the measurements in nanometers. A nanometer is
 meters and is
abbreviated nm. The wavelength for the red, green and blue peaks are
about 570-645 nm, 526-535 nm, and 444-445 nm. The visible wavelength
range (called the mesopic range) is 380 to
about 700-770 nm [Netravali]
[Cohen].
meters and is
abbreviated nm. The wavelength for the red, green and blue peaks are
about 570-645 nm, 526-535 nm, and 444-445 nm. The visible wavelength
range (called the mesopic range) is 380 to
about 700-770 nm [Netravali]
[Cohen].
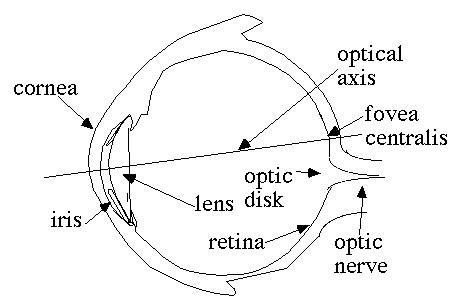
Fig. 5-1. Sketch of a
Human Eye
Fig. 5-1 shows a sketch of a
human eye. When dimensions are given, they refer to the typical adult
human eye unless otherwise stated. Light passes through the cornea
and is focused on the retina by the lens. Physiological theories use
biological components to explain behaviour. The optical elements in
the eye (cornea, lens and
retina) form the primary biological
components of a photo sensor. Muscles are used
to alter the thickness of the lens and the diameter of the hole
covering the lens, called the iris. The iris
diameter typically varies from 2 to 8 mm. Light passing through the
lens is focused upon the retina. The retina
contains two types of photo sensor cells: rods
and cones.
There are 75 to 150 million
rod cells in the retina. The rods contain a
blue-green absorbing pigment called rhodopsin.
Rods are used primarily for night vision (also called the scotopic
range) and typically have no role in color
vision [Gonzalez and Woods].
Cones are used for daylight
vision (called the photopic range). The tristimulus theory of color
perception is based upon the existence of three types of cones: red,
green and blue. The pigment in the cones is unknown
[Hunt]. We do know that the phenomenon called
adaptation (a process that permits eyes to
alter their sensitivity) occurs because of a change in the pigments
in the cones [Netravali]. The retina cells may
also inhibit each another from creating
a high-pass filter for image
sharpening. This phenomenon is known as lateral
inhibition
[Mylers].
The current model for the
retinal cells shows a cone cell density that
ranges from 900  to
160,000 [Gibson].
There are 6 to 7 million cone cells, with the
density increasing near the fovea. Further
biological examination indicates that the cells
are imposed upon a noisy hexagonal array
[Wehmeier].
to
160,000 [Gibson].
There are 6 to 7 million cone cells, with the
density increasing near the fovea. Further
biological examination indicates that the cells
are imposed upon a noisy hexagonal array
[Wehmeier].
Lest one be tempted to count
the number of cells in the eye and draw a direct comparison to modern
camera equipment, keep in mind that even the fixated eye is
constantly moving. One study showed that the eyes perform over 3
fixations per second during a search of a complex scene
[Williams]. Further more, there is nearly a
180-degree field of view (given two eyes). Finally, the eye-brain
interface enables an integration between the sensors’ polar
coordinate scans, focus,
iris adjustments and the interpretation engine.
These interactions are not typical of most artificial image
processing systems [Gonzalez and Woods]. Only
recently have modern camcorders taken on the role of integrating the
focus and exposure adjustment with the sensor.
The optic nerve has
approximately 250,000 neurons connecting to the brain. The brain has
two components associated with low-level vision
operations: the lateral geniculate nucleus and the visual
cortex. The cells are modeled using a circuit
that has an inhibit input, capacitive-type electrical storage and
voltage leaks, all driving a comparitor with a variable voltage
output.
The capacitive storage
elements are held accountable for the critical fusion frequency
response of the eye. The critical fusion frequency is the rate of
display whereby individual updates appear as if they are continuous.
This frequency ranges from 10-70 Hz depending on the color
[Teevan] [Netravali]. At
70 Hz, the 250,000-element optic nerve should carry 17.5 million
neural impulses per second. Given the signal-to-noise ratio of a
human auditory response system (80 dB), we can estimate that there
are 12.8 bits per nerve leading to the brain
[Shamma]. This gives a bit rate of about 224
Mbps. The data has been pre-processed by the eye before it reaches
the optic nerve. This preprocessing includes lateral inhibition
between the retinal neurons. Also, we have assumed that there is
additive white Gaussian noise on the channel, but this assumption may
be justified.
Physiological study has
shown that the response of the cones is given by a Gaussian
sensitivity for the cone center and surrounding fields. The overall
sensitivity is found by subtracting the surrounding response from the
center response. This gives rise to a difference of Gaussian
expression which is discussed in Chap. 10. Further, the exponential
response curve of the eye is the primary reason why exponential
histogram equalization was used in Chap. 4.
5.2. Overview of Image Processing
An image processing system
consists of a source of image data, a processing element and a
destination for the processed results. The source of image data may
be a camera, a scanner, a mathematical equation, statistical data,
the Web, a SONAR system, etc. In short, anything able to generate or
acquire data that has a two-dimensional structure is considered to be
a valid source of image data. Furthermore, the data may change as a
function of time.
The processing element is a
computer. The computer may be implemented in a number of different
ways. For example, the brain may be said to be a kind of biological
computer that is able to perform image processing (and do so quite
well!). The brain consumes about two teaspoons of sugar and 20 watts
of power per hour. An optical element can be used to perform
computation and does so at the speed of light (and with very little
power). This is a fascinating topic of current research
[Fietelson]. In fact, the injection of optical
computing elements can directly produce information about the range
of objects in a scene [DeWitt and
Lyon].
Such computing elements are
beyond the scope of this book. The only type of computer that we will
discuss in this book is the digital computer. However, it is
interesting to combine hybrid optical and digital computing. Such an
area of endeavor lies in the field of photonics.
The output of the processing
may be a display, created for the human visual system. Output can
also be to any stream. In Java, a stream is defined as an uninterpreted
sequence of bytes. Thus, the output may not be image data at all. For
example, the output can be a histogram, a global average, etc. As the
output of the program renders a higher level of interpretation, we
cross the fuzzy line from image processing into the field of
vision. As
an example, consider that image processing is used to edge detect the
image of coins on a table. Computer vision is used to tell how much
money is there. Thus, computer vision will often make use of image
processing as a sub-task.
5.2.1. Digitizing a Signal
Digitizing is a process that
acquires quantized samples of continuous signals. The signals
represent an encoding of some data. For example, a microphone is a
pressure transducer that produces an electrical signal. The
electrical signal represents acoustic pressure waves (sound).
The term analog refers to a signal
that has a continuously varying pattern of intensity. The term
digital
means that the data takes on discrete values. Let s(t) be a continuous signal.
Then, by definition of continuous,
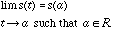 (5.1)
(5.1)
We use the symbol
R to
denote the set of real numbers. Thus  , which says that
R is
the set of all x such that x is a real number.
We read (5.1) saying, in the limit, as t approaches
a,
such that a is a member of the set of real numbers,
, which says that
R is
the set of all x such that x is a real number.
We read (5.1) saying, in the limit, as t approaches
a,
such that a is a member of the set of real numbers,
 . The
expression
. The
expression  is read as “the set of all x’s such that
P(x)
is true” [ Moore 64].
is read as “the set of all x’s such that
P(x)
is true” [ Moore 64].
This is an iff (i.e., if and only if)
condition. Thus, the converse must also be true. That is,
 is not
continuous iff there exists a value, a such that:
is not
continuous iff there exists a value, a such that:
 (5.2)
(5.2)
is true.
For example, if
 has multiple
values at a, then the limit does not exist at a.
has multiple
values at a, then the limit does not exist at a.
The analog-to-digital
conversion consists of a sampler and a quantizer. The quantization is
typically performed by dividing the signal into several uniform
steps. This has the effect of introducing quantization noise
. Quantization noise is given, in dB,
using
 (5.3)
(5.3)
where SNR is the
signal-to-noise ratio and b is the number of
bits. To prove (5.3), we follow [ Moore] and assume that the input signal ranges from -1 to
1 volts. That is,
 (5.3a)
Note that the number of
quantization intervals is  . The least significant bit has a quantization size
of
. The least significant bit has a quantization size
of  .
Following [ Mitra], we obtain the bound on the size of the error with:
.
Following [ Mitra], we obtain the bound on the size of the error with:
 (5.3b)
The variance of a random
variable, X, is found by  where
where  is a probability distribution function. For the
signal whose average is zero, the variance of (5.3b) is
is a probability distribution function. For the
signal whose average is zero, the variance of (5.3b) is
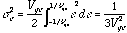 (5.3c).
The signal-to-noise ratio
for the quantization
power is
 (5.3d)
Hence the range on the
upper bound for the signal-to-quantization noise power is
(5.3).
Q.E.D.
In the above proof we
assumed that uniform steps were used over a signal whose average
value is zero. In fact, a digitizer does not have to requantize an image so that steps
are uniform. An in-depth examination of the effects of non-linear
quantization on SNR is given in [Gersho]. Following Gersho, we
generalize the result of (5.3), defining the SNR as
 (5.3e)
where
and  is the
mean-square
distortion
defined by the inner product
between the square of the quantization error for value
x
and the probability of value x. The inner product
between e and p is given by
is the
mean-square
distortion
defined by the inner product
between the square of the quantization error for value
x
and the probability of value x. The inner product
between e and p is given by
 (5.3f).
where
 (5.3g).
The inner product is an
important tool in transform theory. We will expand our discussion of
the inner product when we touch upon the topic of sampling.
We define Q(x) as the
quantized value for x. Maximizing SNR requires that we select the quantizer to minimize
(5.3f), given a priori
knowledge of the PDF (if the PDF is
available). Recall that for an image, we compute the PMF (using the
Histogram class) as well as the CMF.
As we shall see later, (5.3f) is minimized for k-level thresholding
(an intensity reduction to k colors) when the
regions of the CMF
are divided into k sections. The
color is then remapped into the center of each of the CMF regions.
Hence (5.3f) provides a mathematical basis for reducing the number of
colors in an image provided that the PDF is of zero mean (i.e, no DC offset) and has even
symmetry about zero. That is  . Also, we assume that the quantizer has odd symmetry
about zero, i.e.,
. Also, we assume that the quantizer has odd symmetry
about zero, i.e.,  .
.
A simple zero-memory
4-point quantizer
inputs 4 decision levels and outputs 4
corresponding values for input values that range within the 4
decision levels. When the decision levels are placed into an array of
double
precision numbers,
in Java (for the 256 gray-scale values) we write:
public
void
thresh4(double d[]) {
short lut[] = new short[256];
if (d[4] ==0)
for ( int i=0; i <
lut.length; i++) {
if (i < d[0]) lut[i] = 0;
else if (i < d[1]) lut[i] = ( short)d[0];
else if (i < d[2]) lut[i] = ( short)d[1];
else if (i < d[3]) lut[i] = ( short)d[2];
else lut[i] = 255;
System.out.println(lut[i]);
}
}
We shall revisit
quantization in Section 5.2.2.
Using the Java AWT’s
Image class, we have seen that 32 bits are used, per pixel
(red, green,
blue and alpha). There
are only 24 bits used per color, however.
Section 5.2.2 shows how this relates to the software of this book.
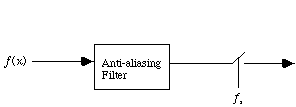
Recall also that the
digitization process led to sampling an analog signal. Sampling a
signal alters the harmonic content (also known as the
spectra) of the signal.
Sampling a continuous signal may be performed
with a pre-filter and a switch. Fig. 5-2 shows a continuous function,
 , being
sampled at a frequency of
, being
sampled at a frequency of  .
.
Fig. 5-2. Sampling System
The switch in Fig. 5-2 is
like a binary amplifier that is being turned on and off every
 seconds. It
multiplies by
an amplification factor of zero or one. Mathematically,
sampling is expressed as a pulse train,
seconds. It
multiplies by
an amplification factor of zero or one. Mathematically,
sampling is expressed as a pulse train,  , multiplied by the
input signal ,
i.e., sampling is ..
, multiplied by the
input signal ,
i.e., sampling is ..
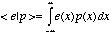
To discuss the pulse train
mathematically, we must introduce the notation for an impulse. The
unit
impulse, or
Dirac
delta, is a
generalized function that is defined by
 (5.4)
(5.4)
where  is arbitrarily small.
The Dirac delta has unit area about a small neighborhood located at
is arbitrarily small.
The Dirac delta has unit area about a small neighborhood located at
 . Multiply the
Dirac delta by a function and it will sift out the values where
the Dirac delta is equal to zero:
. Multiply the
Dirac delta by a function and it will sift out the values where
the Dirac delta is equal to zero:
 (5.5)
(5.5)
This is called the
sifting property
of the Dirac
delta. In fact, the Dirac
delta is equal to zero whenever its argument is non-zero. To make the
Dirac activate, given a non-zero argument, we bias the argument with
an offset,  . A
pulse train is created by adding an infinite number of Dirac
deltas together:
. A
pulse train is created by adding an infinite number of Dirac
deltas together:
 (5.6)
(5.6)
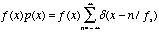 (5.7)
(5.7)
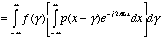
To find the spectra of (5.7)
requires that we perform a Fourier transform . The Fourier transform, just like
any transform, performs a correlation between a function and a
kernel. The kernel of a transform typically consists of an
orthogonal
basis about which
the reconstruction of a waveform may occur. Two functions are
orthogonal if their inner product
 =0. Recall
that the inner product is given by
=0. Recall
that the inner product is given by
 (5.7a)
From linear algebra, we
recall that a collection of linearly
independent functions forms a basis if every value in the set of all possible values may be
expressed as a linear combination of the basis set. Functions are
linearly independent iff the sum of the functions is non-zero (for non-zero
co-efficients). Conversely, functions are linearly dependent
iff there
exists a combination of non-zero coefficients for which the summation
is zero. For example:
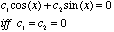 (5.7b)
The ability to sum a series
of sine and cosine functions together to create an arbitrary function
is known an the super position
principle and applies only to periodic
waveforms. This was discovered in the 1800’s by Jean Baptiste
Joseph de Fourier
[Halliday] and is expressed as a summation of
sine and cosines, with constants that are called Fourier
coefficients.
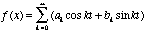 (5.7c)
We note that (5.7c) shows
that the periodic signal has discrete spectral components. We find
the Fourier coefficients by taking the inner product of the function,
f(x) with
the basis functions, sine and cosine. That is:
 (5.7d)
For an elementary
introduction to linear algebra, see [Anton].
For a concise summary see [Stollnitz]. For an
alternative derivation see [Lyon and
Rao].
It is also possible to
approximate an aperiodic waveform. This is done with the Fourier transform . The
Fourier transform uses sine and cosine as the basis functions to form
the inner product, as seen in (5.7a):
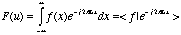 (5.8).
By Euler’s identity,
 (5.9)
(5.9)
we see that the sine and
cosine basis functions are separated by being placed on the real and
imaginary axis.
Substituting (5.7) into
(5.8) yields
 (5.10)
where
 (5.11)
The term
 (5.12)
defines a convolution. We
can write (5.10) because multiplication in the time domain is
equivalent to convolution in the frequency domain. This is known as
the convolution theorem. Taking the Fourier transform of the
convolution between two functions in the time domain results in
 (5.13)
which is expanded by (5.8)
to yield:
 (5.13a)
Changing the order of
integration in (5.13a) yields
 (5.13b)
with
 (5.13c)
and
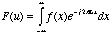 (5.13d)
we get
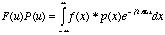 (5.14).
This shows that convolution
in the time domain is multiplication in the frequency domain. We can
also show that convolution in the frequency domain is equal to
multiplication in the time domain. See
[Carlson] for an alternative proof.
As a result of the
convolution theorem, the Fourier transform of an impulse train is
also an impulse train,
 (5.15)
Finally, we see that
sampling a signal at a rate of
 causes the
spectrum to be reproduced at intervals:
causes the
spectrum to be reproduced at intervals:
 (5.16)
(5.16) demonstrates the
reason why a band limiting filter is needed before the switching
function of Fig. 5-2. This leads directly to the sampling theorem
which states that a band limited signal may be reconstructed without
error if the sample rate is twice the bandwidth. Such a sample rate
is called the Nyquist rate and is given by  .
.
5.2.2. Image Digitization
Typically, a camera is used to
digitize an image. The modern CCD cameras have a photo diode arranged
in a rectangular array. Flat-bed scanners use a movable platen and a
linear array of photo diodes to perform the
two-dimensional digitization.
Older tube type cameras used
a wide variety of materials on a
photosensitive surface. The materials vary in
sensitivity and output. See [Galbiati] for a
more detailed description on tube cameras.
The key point about
digitizing an image in two dimensions is that we are able to detect
both the power of the incident energy as well as the direction.
The process of digitizing an
image is described by the amount of spatial resolution and the signal
-to-noise ratio (i.e., number of bits per pixel) that the digitizer
has. Often the number of bits per pixel is limited by performing a
thresholding. Thresholding (a topic treated more thoroughly in Chap.
10) reduces the number of color values available in an image. This
simulates the effect of having fewer bits per pixel available for
display. There are several techniques available for thresholding. For
the grayscale image, one may use the cumulative mass function for the
probability of a gray value to create a new look-up table. Another
approach is simply to divide the look-up table into uniform sections.
Fig. 5-2 shows the mandrill before and after thresholding operation.
The decision about when to increment the color value was made based
on the CMF of the image. The number of bits
per pixel (bpp), shown in Fig. 5-2, ranging from left to right, top
to bottom, are: 1 bpp, 2 bpp, 3 bpp and 8 bpp. Keep in mind that at a
bit rate of 28 kbps (the rate of a modest Internet connection over a
phone line) the 8 bpp image (128x128) will take 4 seconds to
download. Compare this to the uncompressed 1 bpp image which will
take 0.5 seconds to download. Also note that the signal-to-noise
ratio for these images ranges from 10 dB to 52 dB.
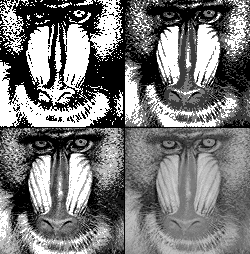
Fig. 5-3. Quantizing with
Fewer Bits Per Pixel
The code snippet allows the
cumulative mass function of the image to bias
decisions about when to increment the color value. The input to the
code is the number of gray values, k.
There are several methods to perform
the quantization. The one shown in Fig. 5-3 is useful in edge
detection (a topic covered in Chap. 10). The
kgreyThresh method follows:
public
void
kgreyThresh(double k) {
Histogram rh =
new Histogram(r,"red");
double cmf[]
= rh.getCMF();
TransformTable tt =
new
TransformTable(cmf.length);
short lut[] =
tt.getLut();
int q=1;
short v=0;
short dv = (
short)(255/k);
for (
int i=0; i < lut.length; i++) {
if (cmf[i]
> q/k) {
v += dv;
q++;
//(k == q+1)||
if (q==k)
v=255;
}
lut[i]=v;
}
tt.print();
}
5.2.3. Image Display
One display device that has
come into common use is the cathode-ray tube
(CRT). The cathode ray tube displays an image
using three additive colors: red, green and blue. These colors are
emitted using phosphors that are stimulated with a flow of electrons.
Different phosphors have different colors (spectral radiance).
There are three kinds of
television systems in the world today, NTSC,
PAL and SECAM. NTSC
which stands for National Television
Subcommittee, is used in North America and
Japan. PAL stands for phase alternating line and is used in parts of
Europe, Asia, South America and
Africa. SECAM stands
for Sequential Couleur à Mémorie
(sequential chrominance signal and memory) and is used in France,
Eastern Europe and
Russia.
The
gamut of colors and the reference color known
as white
(called white balance) are different on each of the systems.
Another type of display held
in common use is the computer monitor.
Factors that afflict all
displays include: ambient light, brightness (black level) and
contrast (picture). There are also phosphor chromaticity differences
between different CRTs. These alter the color gamut that may be
displayed.
Manufacturers’
products are sometimes adopted as a standard for the color gamut to
be displayed by all monitors. For example, one U.S. manufacturer,
Conrac, had a phosphor that was adopted by SMPTE (Society of Motion
Picture and Television Engineers) as the basis
for the SMPTE C phosphors.
The CRTs have a transfer
function like that of (4.14), assuming the value, v ranges from zero to one:
 (5.3)
(5.3)
Typically, this is termed
the gamma of a monitor and runs to a value of 2.2 [Blinn]. As
Blinn points out, for a gamma of 2, only 194 values appear in a
look-up table of 256 values. His suggestion that 16 bits per color
might be enough to perform image processing has been taken to heart,
and this becomes another compelling reason to use the Java
short for
storing image values. Thus, the image processing software in this
book does all its image processing as if intensity were linearly
related to the value of a pixel. With the storage of 48 bits per
pixel (for red, green and blue) versus the Java AWT model of 24 bits
per red, green and blue value, we have increased our signal-to-noise
ratio for our image representation by 48 dB per color. So far, we
have not made good use of this extra bandwidth, but it is nice to
know that it is there if we need it.